The Monitoring page is only available to legacy "classic" workflow users.
Monitoring Dashboard
The Monitoring dashboard allows you to monitor the performance of your deployed Model (#1 in the screenshot below). You can also be notified of any changes to the Model's performance by creating Alerts (#2 in the screenshot below). The Monitoring dashboard generates data by pulling information from images predicted via Run Live (or Cloud Inference). Run Live is performed on the Live Prediction tab.
When you first open the Monitoring tab, it may be empty. To populate information on the Monitoring tab, go to the Live Prediction tab and select a Device and Deployment Bundle.
Select a Device and a Deployment Bundle on the "Live Prediction" Tab
Analyze Reports on the Monitoring TabThe name of the selected device will display above the Detection Rate report. In the screenshot below, the name of the default device is 11589.
The data in the Detection Rate report is separated into categories:
Avg. Detection Rate: The average of the total number of images with at least one Class detected over the total number of images analyzed. For example, if the Model detected a Class in 6 out of 8 images, the average would be 75%. (6 ÷ 8 = 0.75)
Avg. Confidence: The average of the totalConfidence Score over the total number of Classes detected.
Indicates how certain the AI is that its Prediction is correct. For example, in the screenshot below, the AI is 0.94 (or 94%) confident that their Prediction is a screw.
Indicates how certain the AI is that its Prediction is correct. For example, in the screenshot below, the AI is 0.94 (or 94%) confident that their Prediction is a screw.
Indicates how certain the AI is that its Prediction is correct. For example, in the screenshot below, the AI is 0.94 (or 94%) confident that their Prediction is a screw.
Indicates how certain the AI is that its Prediction is correct. For example, in the screenshot below, the AI is 0.94 (or 94%) confident that their Prediction is a screw.
Indicates how certain the AI is that its Prediction is correct. For example, in the screenshot below, the AI is 0.94 (or 94%) confident that their Prediction is a screw.
Indicates how certain the AI is that its Prediction is correct. For example, in the screenshot below, the AI is 0.94 (or 94%) confident that their Prediction is a screw.
Indicates how certain the AI is that its Prediction is correct. For example, in the screenshot below, the AI is 0.94 (or 94%) confident that their Prediction is a screw.
Indicates how certain the AI is that its Prediction is correct. For example, in the screenshot below, the AI is 0.94 (or 94%) confident that their Prediction is a screw.
Indicates how certain the AI is that its Prediction is correct. For example, in the screenshot below, the AI is 0.94 (or 94%) confident that their Prediction is a screw.
Indicates how certain the AI is that its Prediction is correct. For example, in the screenshot below, the AI is 0.94 (or 94%) confident that their Prediction is a screw.
Indicates how certain the AI is that its Prediction is correct. For example, in the screenshot below, the AI is 0.94 (or 94%) confident that their Prediction is a screw.
Indicates how certain the AI is that its Prediction is correct. For example, in the screenshot below, the AI is 0.94 (or 94%) confident that their Prediction is a screw.
Indicates how certain the AI is that its Prediction is correct. For example, in the screenshot below, the AI is 0.94 (or 94%) confident that their Prediction is a screw.
Indicates how certain the AI is that its Prediction is correct. For example, in the screenshot below, the AI is 0.94 (or 94%) confident that their Prediction is a screw.
Indicates how certain the AI is that its Prediction is correct. For example, in the screenshot below, the AI is 0.94 (or 94%) confident that their Prediction is a screw.
Indicates how certain the AI is that its Prediction is correct. For example, in the screenshot below, the AI is 0.94 (or 94%) confident that their Prediction is a screw.
Indicates how certain the AI is that its Prediction is correct. For example, in the screenshot below, the AI is 0.94 (or 94%) confident that their Prediction is a screw.
Indicates how certain the AI is that its Prediction is correct. For example, in the screenshot below, the AI is 0.94 (or 94%) confident that their Prediction is a screw.
Indicates how certain the AI is that its Prediction is correct. For example, in the screenshot below, the AI is 0.94 (or 94%) confident that their Prediction is a screw.
Indicates how certain the AI is that its Prediction is correct. For example, in the screenshot below, the AI is 0.94 (or 94%) confident that their Prediction is a screw.
Indicates how certain the AI is that its Prediction is correct. For example, in the screenshot below, the AI is 0.94 (or 94%) confident that their Prediction is a screw.
Indicates how certain the AI is that its Prediction is correct. For example, in the screenshot below, the AI is 0.94 (or 94%) confident that their Prediction is a screw.
Indicates how certain the AI is that its Prediction is correct. For example, in the screenshot below, the AI is 0.94 (or 94%) confident that their Prediction is a screw.
Indicates how certain the AI is that its Prediction is correct. For example, in the screenshot below, the AI is 0.94 (or 94%) confident that their Prediction is a screw.
Indicates how certain the AI is that its Prediction is correct. For example, in the screenshot below, the AI is 0.94 (or 94%) confident that their Prediction is a screw.
# Instances Detected: The number of images with at least one Class detected.
# Images Predicted: The number of images predicted.
Detection Rate Report Categories
View Data for Specific Dates
By default, the Detection Rate report shows the calculations for the last seven days; this report does not show the entire history of detection rates. You can see data relevant to a specific date range by selecting dates from the drop-down menu.
Note:
The Detection Rate report can only show up to 14 days of data.
Select a Timeframe
View Graphs
You can click each category to see a graph of the relevant data.
Monitoring Graphs
Indicates how certain the AI is that its Prediction is correct. For example, in the screenshot below, the AI is 0.94 (or 94%) confident that their Prediction is a screw.
Indicates how certain the AI is that its Prediction is correct. For example, in the screenshot below, the AI is 0.94 (or 94%) confident that their Prediction is a screw.
Indicates how certain the AI is that its Prediction is correct. For example, in the screenshot below, the AI is 0.94 (or 94%) confident that their Prediction is a screw.
Indicates how certain the AI is that its Prediction is correct. For example, in the screenshot below, the AI is 0.94 (or 94%) confident that their Prediction is a screw.
Indicates how certain the AI is that its Prediction is correct. For example, in the screenshot below, the AI is 0.94 (or 94%) confident that their Prediction is a screw.
Indicates how certain the AI is that its Prediction is correct. For example, in the screenshot below, the AI is 0.94 (or 94%) confident that their Prediction is a screw.
Indicates how certain the AI is that its Prediction is correct. For example, in the screenshot below, the AI is 0.94 (or 94%) confident that their Prediction is a screw.
Indicates how certain the AI is that its Prediction is correct. For example, in the screenshot below, the AI is 0.94 (or 94%) confident that their Prediction is a screw.
Indicates how certain the AI is that its Prediction is correct. For example, in the screenshot below, the AI is 0.94 (or 94%) confident that their Prediction is a sc
Indicates how certain the AI is that its Prediction is correct. For example, in the screenshot below, the AI is 0.94 (or 94%) confident that their Prediction is a screw.
Indicates how certain the AI is that its Prediction is correct. For example, in the screenshot below, the AI is 0.94 (or 94%) confident that their Prediction is a screw.
Indicates how certain the AI is that its Prediction is correct. For example, in the screenshot below, the AI is 0.94 (or 94%) confident that their Prediction is a screw.
Alerts
Let's say you want to be notified when the number of detections increases substantially. Or, maybe you want to be notified when the Confidence Score decreases significantly. You can be notified by creating Alerts.
Receive Notifications by Creating Alerts
Alert Types
Indicates how certain the AI is that its Prediction is correct. For example, in the screenshot below, the AI is 0.94 (or 94%) confident that their Prediction is a screw.
Indicates how certain the AI is that its Prediction is correct. For example, in the screenshot below, the AI is 0.94 (or 94%) confident that their Prediction is a screw.
Indicates how certain the AI is that its Prediction is correct. For example, in the screenshot below, the AI is 0.94 (or 94%) confident that their Prediction is a screw.
Indicates how certain the AI is that its Prediction is correct. For example, in the screenshot below, the AI is 0.94 (or 94%) confident that their Prediction is a s
Indicates how certain the AI is that its Prediction is correct. For example, in the screenshot below, the AI is 0.94 (or 94%) confident that their Prediction is a screw
Indicates how certain the AI is that its Prediction is correct. For example, in the screenshot below, the AI is 0.94 (or 94%) confident that their Prediction is a screw.
Indicates how certain the AI is that its Prediction is correct. For example, in the screenshot below, the AI is 0.94 (or 94%) confident that their Prediction is a screw.
Indicates how certain the AI is that its Prediction is correct. For example, in the screenshot below, the AI is 0.94 (or 94%) confident that their Prediction is a screw.
Indicates how certain the AI is that its Prediction is correct. For example, in the screenshot below, the AI is 0.94 (or 94%) confident that their Prediction is a screw.
Indicates how certain the AI is that its Prediction is correct. For example, in the screenshot below, the AI is 0.94 (or 94%) confident that their Prediction is a screw.
Indicates how certain the AI is that its Prediction is correct. For example, in the screenshot below, the AI is 0.94 (or 94%) confident that their Prediction is aAlarm Types
Alert Type
Description
Average Defect Rate
Be notified when the Average Detection Rate is at or below the specified number.
Average Confidence
Be notified when the Average Confidence Rate is at or below the specified number.
Volume Decrease
Be notified when theInferencevolume goes below the expected range at least 3 times during the provided time window.
The process of showing images to a Model that the Model has never seen before.
The process of showing images to a Model that the Model has never seen before.
The process of showing images to a Model that the Model has never seen before.
The process of showing images to a Model that the Model has never seen before.
The process of showing images to a Model that the Model has never seen before.
The process of showing images to a Model that the Model has never seen before.
The process of showing images to a Model that the Model has never seen before.
The process of showing images to a Model that the Model has never seen before.
The process of showing images to a Model that the Model has never seen before.
The process of showing images to a Model that the Model has never seen before.
The process of showing images to a Model that the Model has never seen before.
The process of showing images to a Model that the Model has never seen before.
The process of showing images to a Model that the Model has never seen before.
The process of showing images to a Model that the Model has never seen before.
The process of showing images to a Model that the Model has never seen before.
The process of showing images to a Model that the Model has never seen before.
The process of showing images to a Model that the Model has never seen before.
The process of showing images to a Model that the Model has never seen before.
The process of showing images to a Model that the Model has never seen before.
The process of showing images to a Model that the Model has never seen before.
The process of showing images to a Model that the Model has never seen before.
The process of showing images to a Model that the Model has never seen before.
The process of showing images to a Model that the Model has never seen before.
Inference Error
Be notified if at least one internal server error is detected during the specified time window when runningInference.
Note:
Landing AI will always be notified if an internal server error is detected.
The process of showing images to a Model that the Model has never seen before.
The process of showing images to a Model that the Model has never seen before.
The process of showing images to a Model that the Model has never seen before.
The process of showing images to a Model that the Model has never seen before.
The process of showing images to a Model that the Model has never seen before.
The process of showing images to a Model that the Model has never seen before.
The process of showing images to a Model that the Model has never seen before.
The process of showing images to a Model that the Model has never seen before.
The process of showing images to a Model that the Model has never seen before.
The process of showing images to a Model that the Model has never seen before.
The process of showing images to a Model that the Model has never seen before.
The process of showing images to a Model that the Model has never seen before.
The process of showing images to a Model that the Model has never seen before.
The process of showing images to a Model that the Model has never seen before.
The process of showing images to a Model that the Model has never seen before.
The process of showing images to a Model that the Model has never seen before.
The process of showing images to a Model that the Model has never seen before.
The process of showing images to a Model that the Model has never seen before.
The process of showing images to a Model that the Model has never seen before.
The process of showing images to a Model that the Model has never seen before.
The process of showing images to a Model that the Model has never seen before.
The process of showing images to a Model that the Model has never seen before.
The process of showing images to a Model that the Model has never seen before.
The process of showing images to a Model that the Model has never seen before.
Alert Settings
Alert Settings
#
Setting
Description
1
Title
Enter a short, descriptive name for your Alert. This name will help users understand what the Alert is for.
2
Select Device
Select the Device that the Alert should be for.
3
Alarm Type
Choose the type of Alert you want to be notified for.
4
Threshold
Enter a number between 0 and 1. You will be notified when the specified metric exceeds this number during the set Time Window or Count.
5
Window Type & Time Window / Count
Count Based & Count: Configure the number of times the event should occur to be notified.
Time Based & Time Window: Specify the number of minutes that the event should occur at least once to be notified. For example, if you want to receive a notification if an Inference Error should occur in a single day, enter 1440 (or 24 hours).
6
Recipients
Select the users to be notified.
Create Alerts
Go to the Deploy page.
On the Live Prediction tab, select the Model Bundle and Device you want to create an alert for from the drop-down menus.
Model Bundle and Device
Go to the Monitoring tab.
In the Alerts section, click Manage.
Manage Alerts
Click Create Alert.
Create Alert Button
The Create Alert pop-up window displays. Enter a short, descriptive name for the Alert in the Title field.
Select the device you want to create an Alert for from the Device drop-down menu.
Select the type of Alarm you want to create from the Alarm Type drop-down menu.
Configure the Alarm settings.
Click Create.
Create Alerts
Edit or Delete Alerts
Caution:
Removing an Alert is an irreversible action that will delete it from LandingLens. Consider deactivating an Alert if you plan to use it again in the future.
To edit or delete an Alert:
Go to the Deploy page.
On the Live Prediction tab, select the Model Bundle and Device that has the Alert you want to remove from the drop-down menus.
Select a Deployment Bundle and Device
Go to the Monitoring tab.
Click Manage in the Alerts section.
Click the vertical ellipses icon (⋮) and select Edit or Removeaccordingly.
Edit or Remove an Alert
Deactivate Alerts
If you have an Alert that you no longer want, you can deactivate it. You can always reactivate it later.
To deactivate an Alert:
Go to the Deploy page.
On the Live Prediction tab, select the Model Bundle and Device that has the Alert you want to remove from the drop-down menus.
Select a Deployment Bundle and Device
Go to the Monitoring tab.
Click Manage in the Alerts section.
Click Deactivate for the Alert you want to turn off.
Deactivate an AlertTo reactivate an Alert, click Activate.
Reactivate an Alert
Indicates how certain the AI is that its Prediction is correct. For example, in the screenshot below, the AI is 0.94 (or 94%) confident that their Prediction is a screw.
Indicates how certain the AI is that its Prediction is correct. For example, in the screenshot below, the AI is 0.94 (or 94%) confident that their Prediction is a screw.
The process of showing images to a Model that the Model has never seen before.
The process of showing images to a Model that the Model has never seen before.
Was this article helpful?
Thank you for your feedback! Our team will get back to you
.png) Monitoring Tab
Monitoring Tab .png) Analyze Reports on the Monitoring TabThe name of the selected device will display above the Detection Rate report. In the screenshot below, the name of the default device is 11589.
Analyze Reports on the Monitoring TabThe name of the selected device will display above the Detection Rate report. In the screenshot below, the name of the default device is 11589..png) Device Name
Device Name
(1).png)

(1).png)
.png)
 Detection Rate Report Categories
 .png)
 Monitoring Graphs
.png)
.png) Alert Settings
Alert Settings .png) Model Bundle and Device
Model Bundle and Device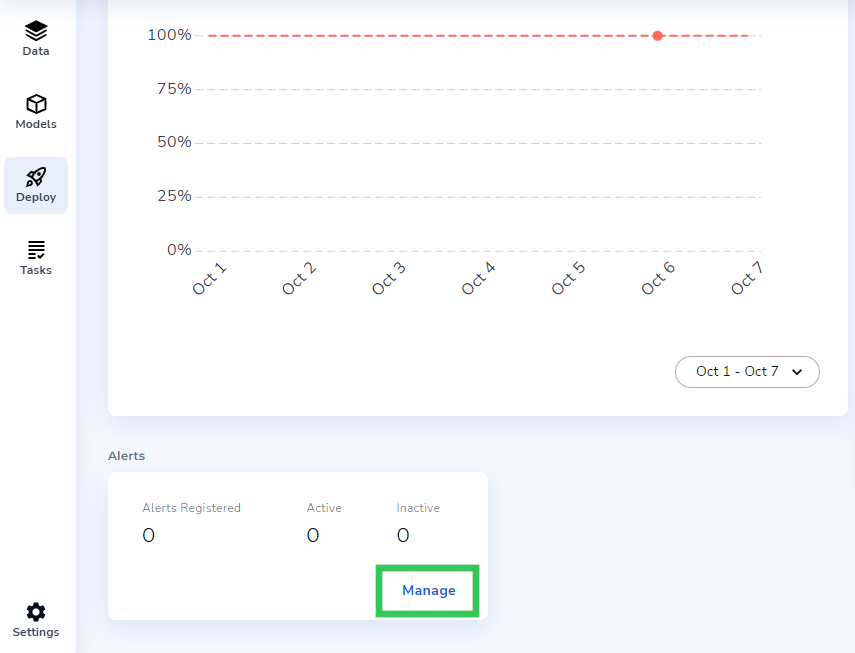 Manage Alerts
 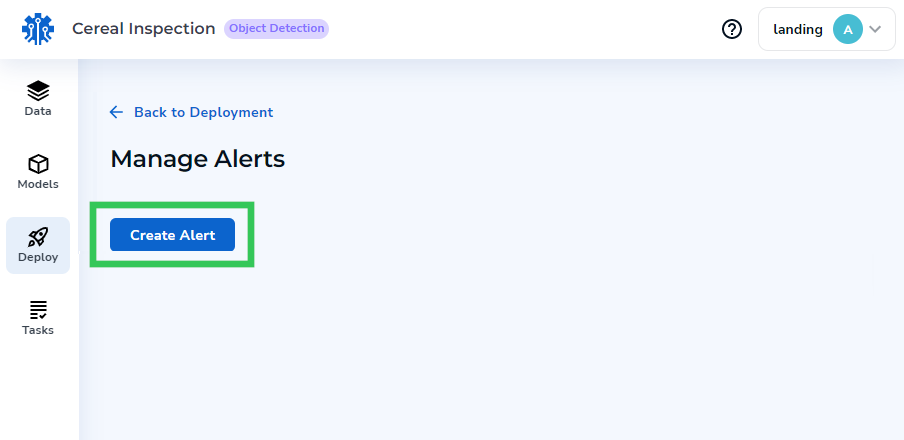 Create Alert Button
 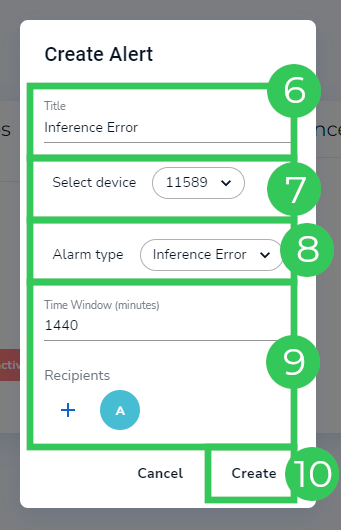 Create Alerts
 .png)


.png) Select a Deployment Bundle and Device
Select a Deployment Bundle and Device 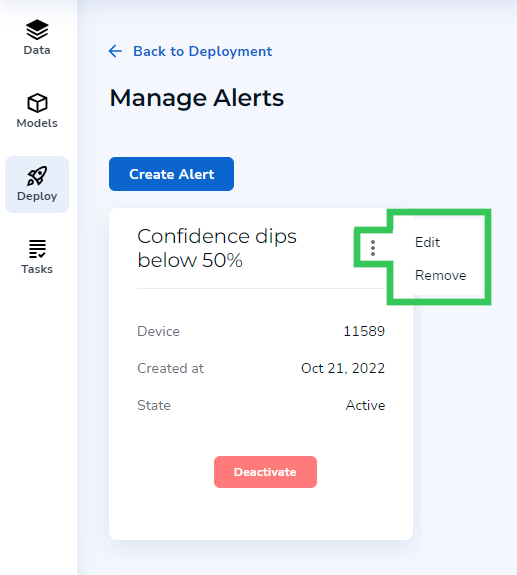 Edit or Remove an Alert
.png) Select a Deployment Bundle and Device
Select a Deployment Bundle and Device 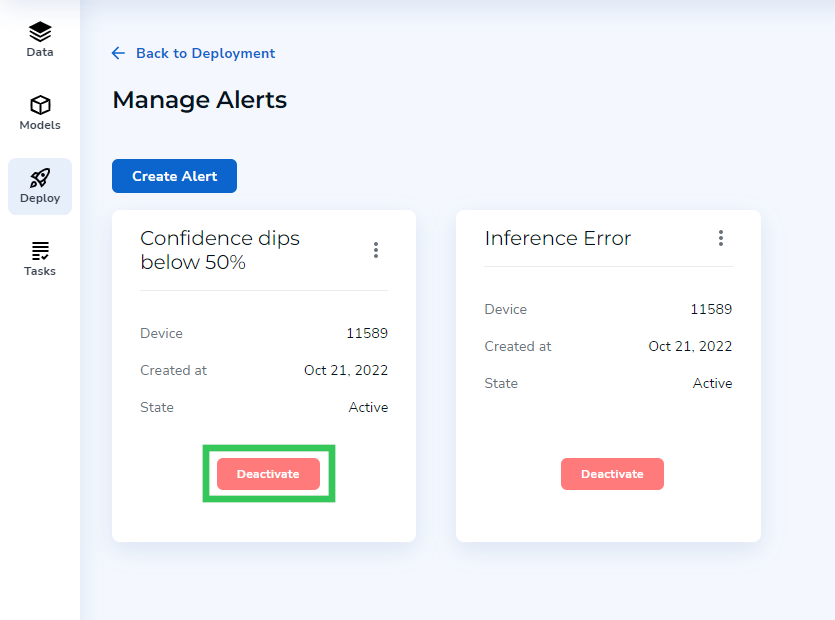 Deactivate an AlertTo reactivate an Alert, click Activate.
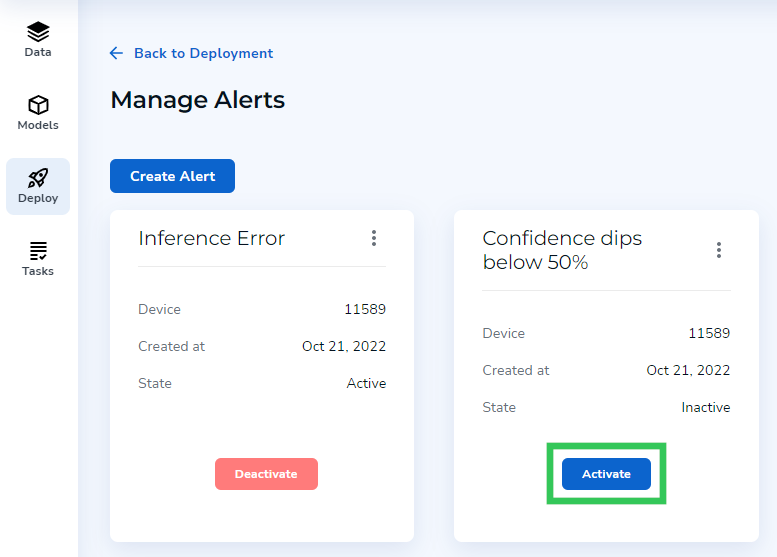 Reactivate an Alert
