View Predictions
- 03 Oct 2023
- 2 Minutes to read
- Print
- DarkLight
- PDF
View Predictions
- Updated on 03 Oct 2023
- 2 Minutes to read
- Print
- DarkLight
- PDF
Article Summary
Share feedback
Thanks for sharing your feedback!
Note:
The information in this section is not applicable to Visual Prompting. For more information, go to Visual Prompting.
After completing Model training, you can view the Predictions for each image. Predictions are what the AI believes is the object to identify. Predictions are represented as dotted lines (for Object Detection and Classification Project Types) and highlights (for the Segmentation Project Type).
There are a couple of ways to view Predictions:
- View Predictions one image at a time: Click an image and open the View tab. Predictions display for each image.
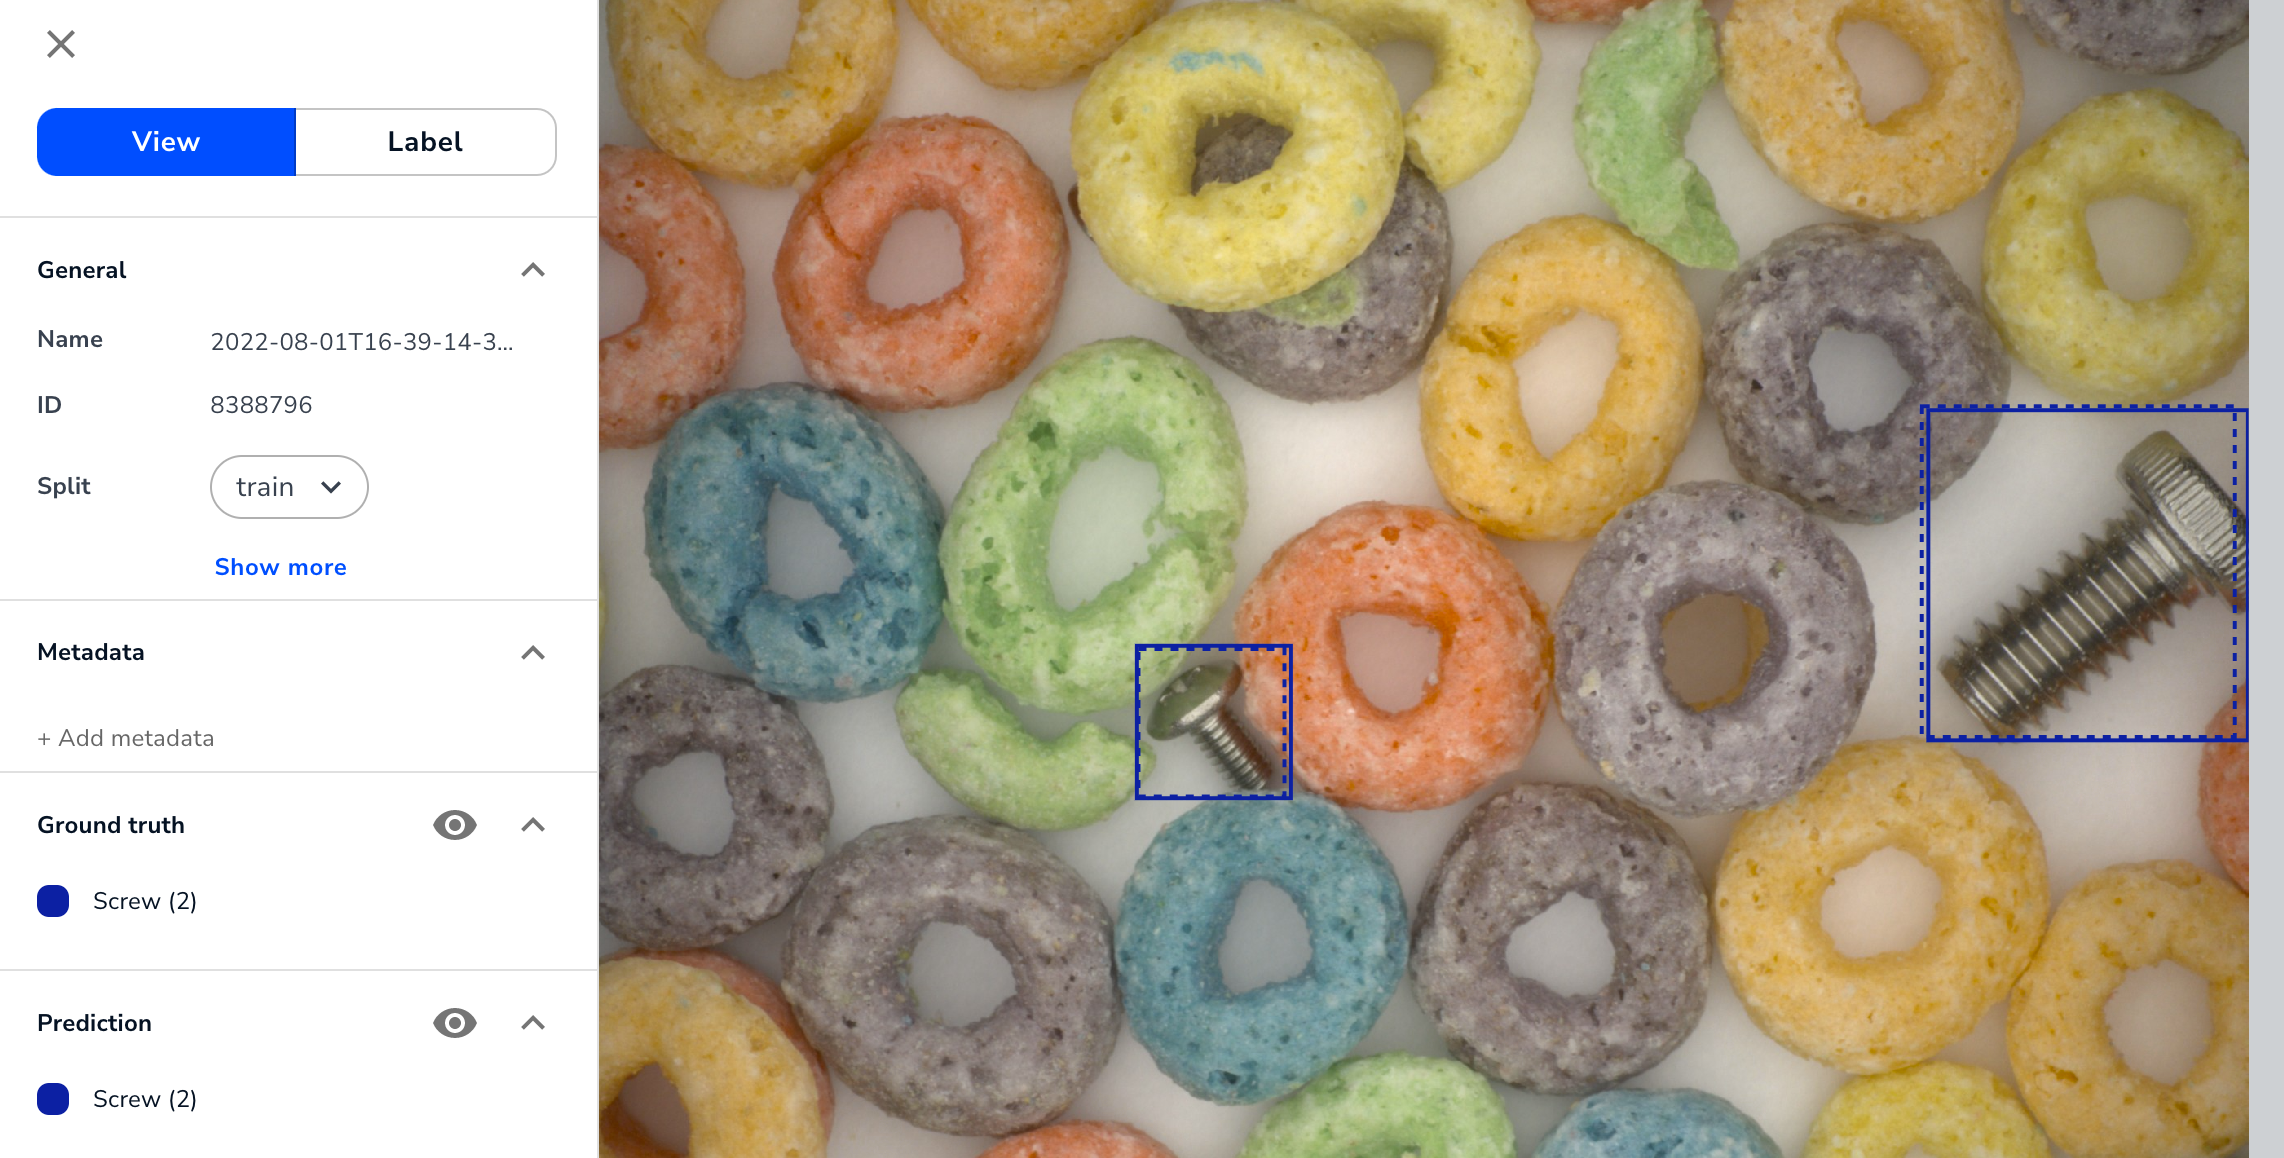 View Predictions for a Selected Image
 - View the Predictions on multiple images at once: Select the Prediction checkbox. You can change from Images View to Instances View as needed.
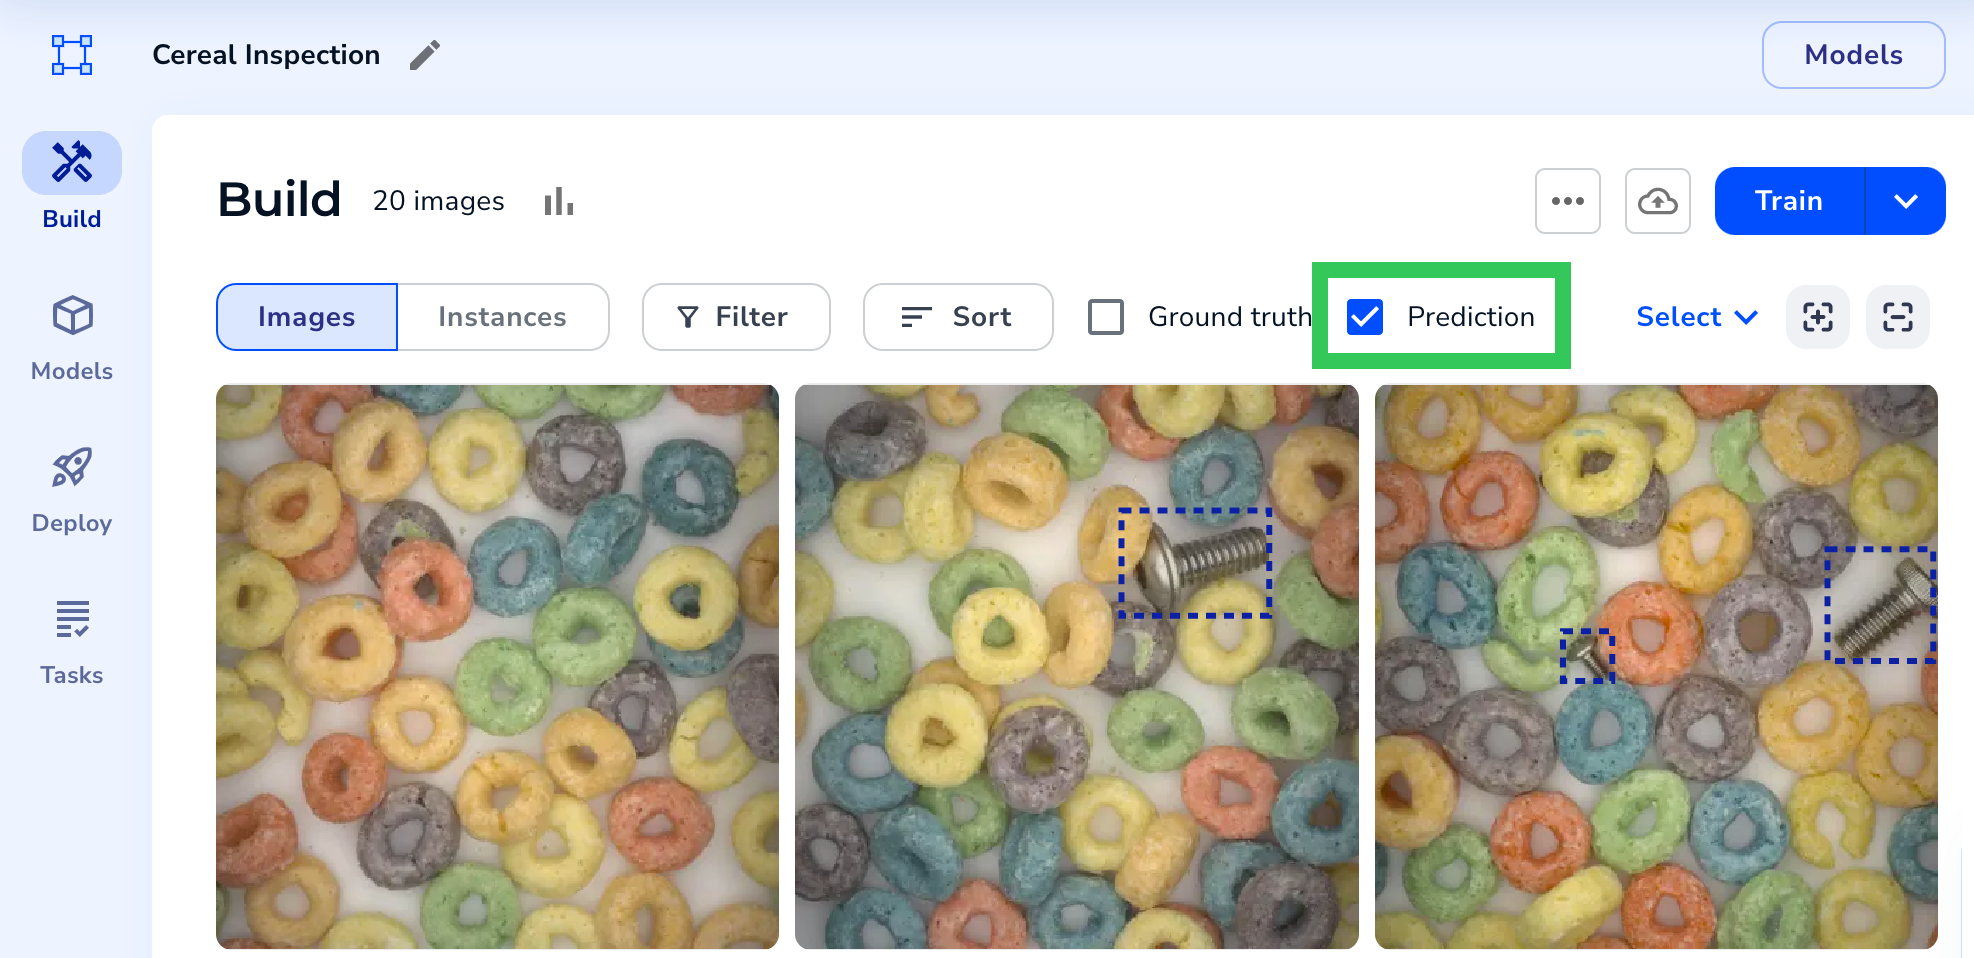 See Predictions for All Images


Tip:
To better view Predictions, you can hide the Ground Truth.
Images View
Images View allows you to view all labels in a single image simultaneously. For example, let's say you have two labels in an image. You can view both of these labels in Images View.
 Images View
Instances View
Instances View allows you to only view one label in an image (or one "instance") at a time. Furthermore, the images are zoomed in to help you see the labeled object. This is useful if you have large images that include tiny objects.
.png) Instances View
Instances ViewInstances View also includes a Confidence Score. The Confidence Score represents how certain (or "confident") the AI is that its Prediction is accurate. For example, in the screenshot below, the AI is 91% (or 0.91) confident that the Prediction is a screw.
 Confidence Score in Images View
View Predictions for New Images
In addition to viewing Predictions for images you've already uploaded to your Project, you can also view Predictions for new images—without needing to upload them to your Project. This is a good way to test your Model before deploying it.
To do this:
- Open the Project.
- Click Models.
- Select a Model.
- Click Predict.
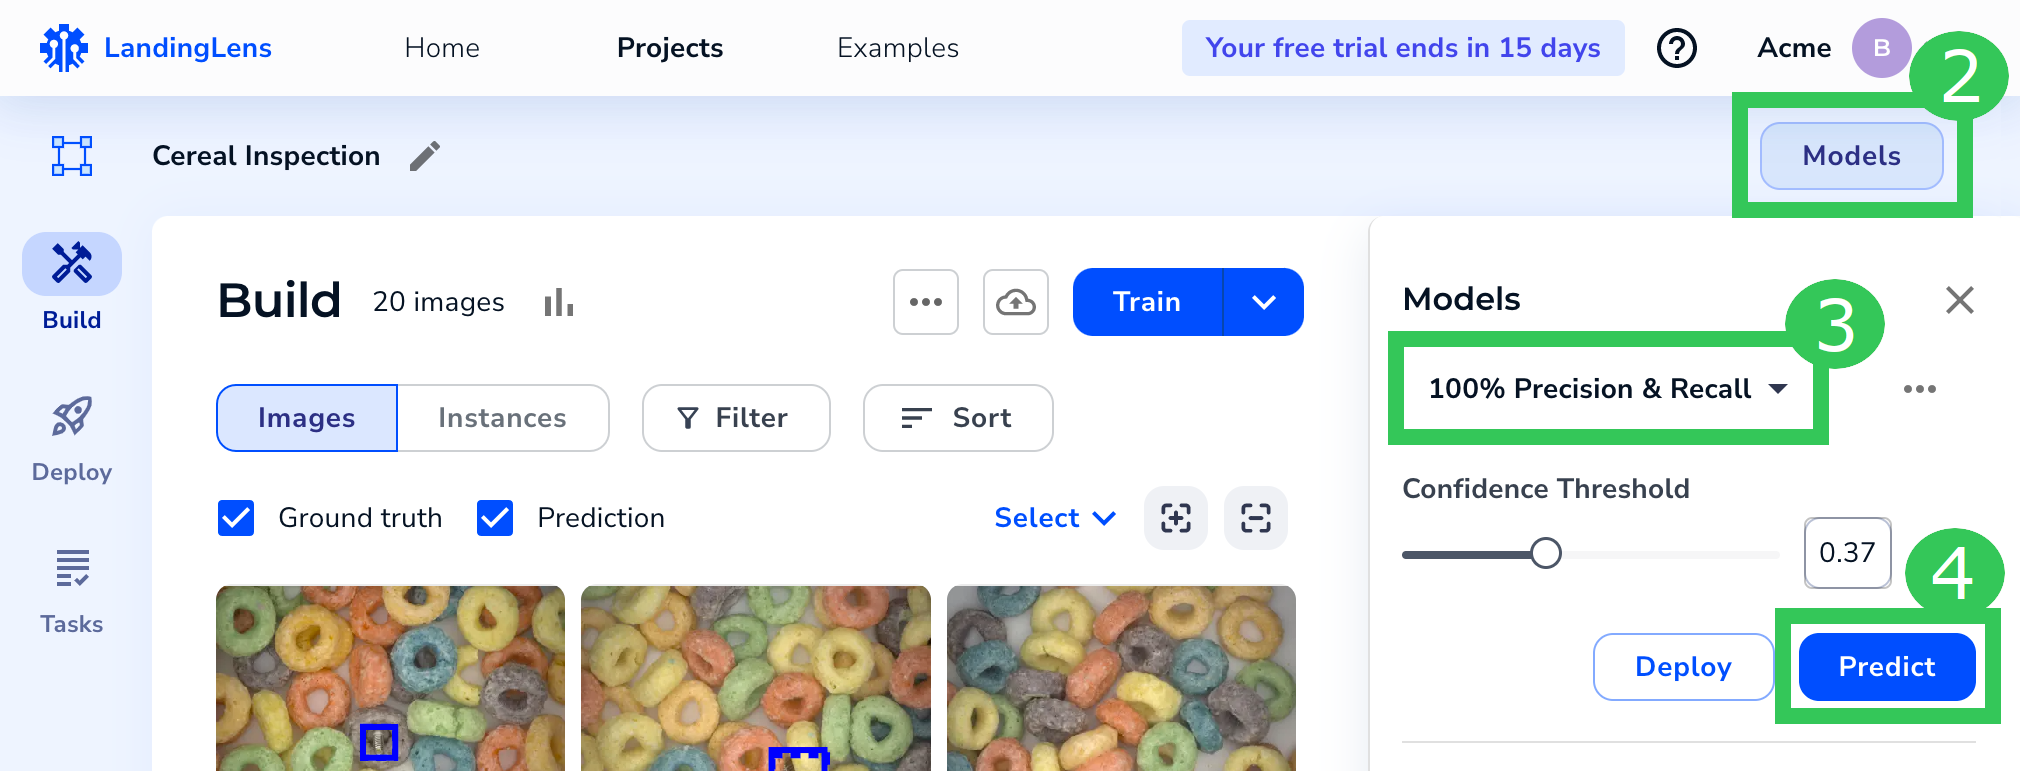 Run the Model on New Images
 - Upload the images.
- LandingLens runs the model and shows you the results. You can:

- View the predicted areas.
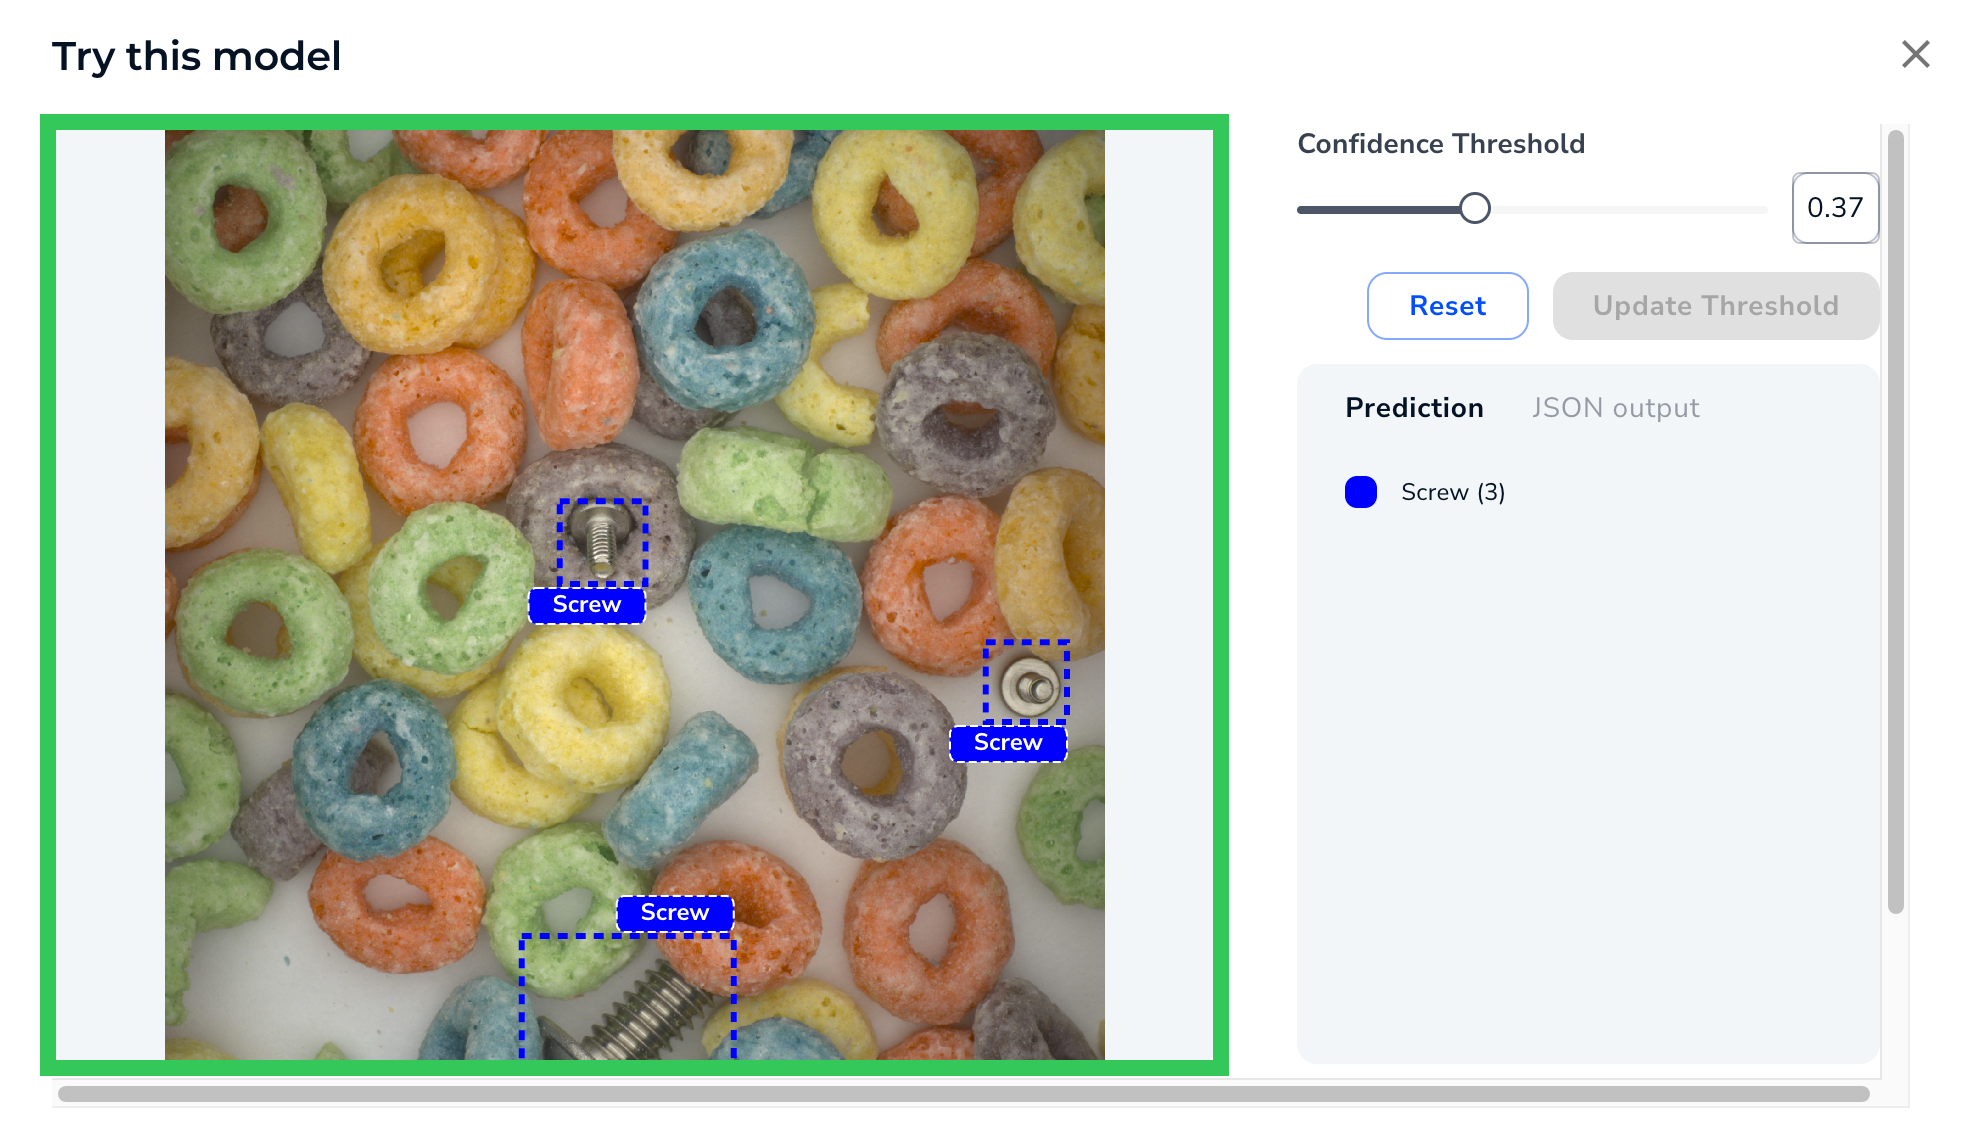 Predicted Areas Are Marked
 - Hover over the Confidence Threshold slider to see the Data Performance graph of the Model. For more information about this graph, go to Confidence Threshold.
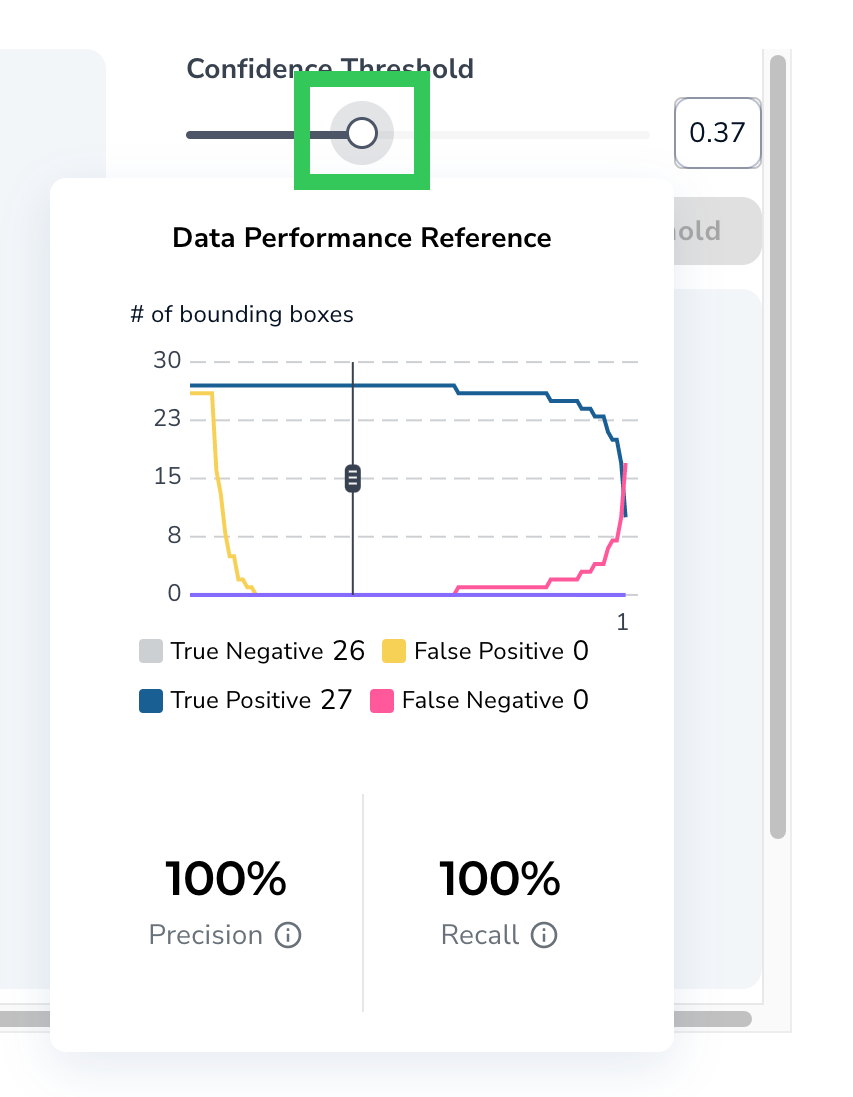 See the Data Performance Graph
 - Adjust the Confidence Threshold. Then click Update Threshold to update the Model and redeploy. Or click Reset to return to the original threshold. For more information about the threshold, go to Confidence Threshold.
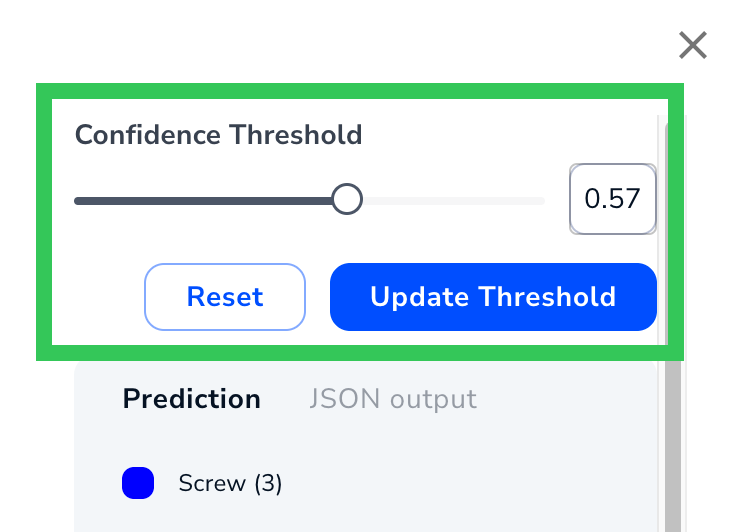 Update the Confidence Threshold
 - Click JSON output to see the coordinates of the labels. For more information, go to JSON Output.
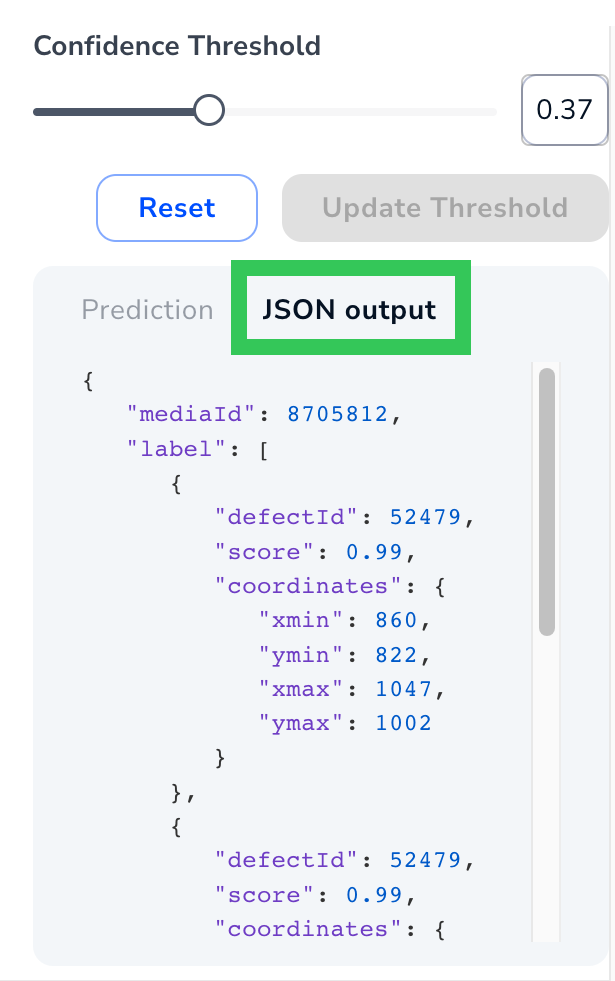 JSON Output
 - Click the Upload or Webcam icon to run inference on more images.
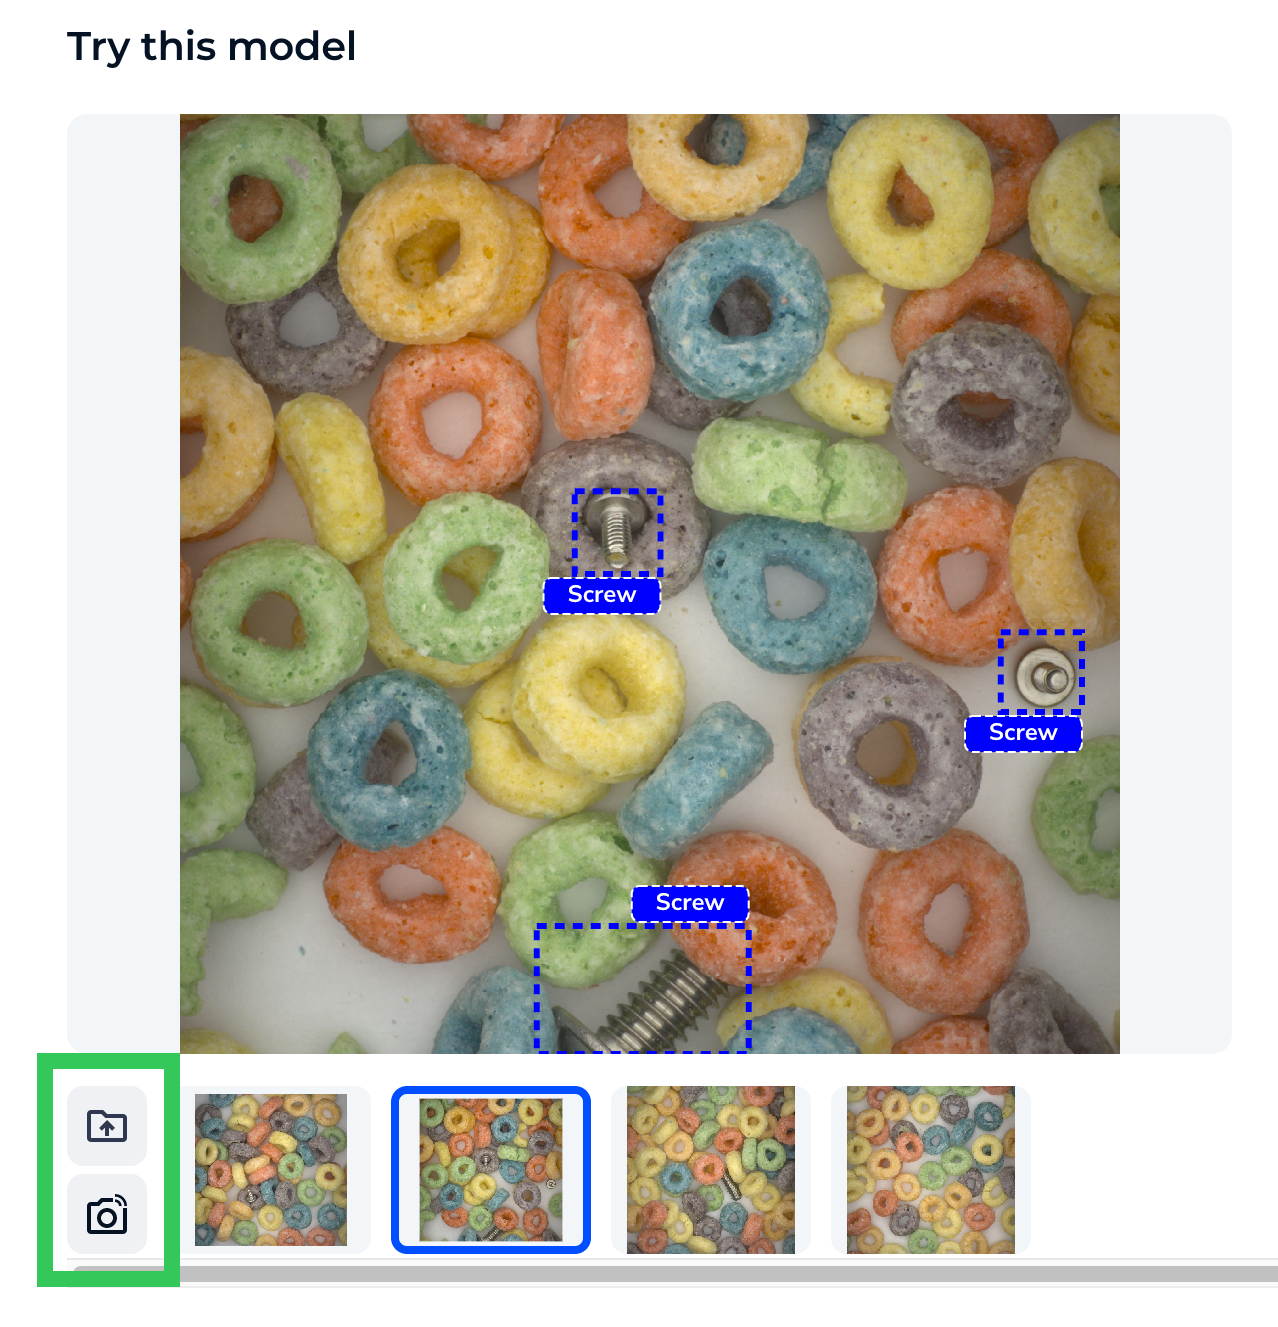 Upload More Images


.png)
Was this article helpful?